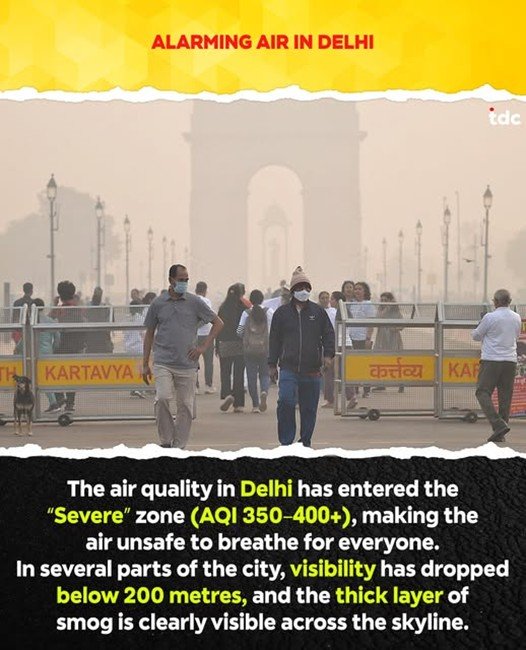
Delhi today stands among the most polluted capital cities in the world. During peak winter days, the city’s Air Quality Index (AQI) has repeatedly crossed 300, categorised as Very Poor, with several monitoring stations touching Severe levels above 400 (Central Pollution Control Board daily AQI data). According to CPCB records, more than 65–70% of winter days in Delhi fall under Poor to Severe AQI categories, leaving residents exposed to hazardous air for nearly three months each year (CPCB annual AQI summary).
This is not an episodic anomaly but a structural urban crisis unfolding every winter.
(Source: TDChronicles. (2025, December). Delhi’s air quality deteriorates again; severe pollution recorded across the city.)
Decoding the Data: What AQI and PM Levels Reveal
Fine particulate matter, PM2.5, is the primary pollutant driving Delhi’s air crisis. The national 24-hour safe limit for PM2.5 is 60 µg/m³, while the World Health Organization guideline is 15 µg/m³. In Delhi, winter averages often range between 150–250 µg/m³, with peak episodes crossing 300 µg/m³ (CPCB National Air Quality Monitoring Programme; WHO Air Quality Guidelines).
Similarly, PM10 levels, with a national safe limit of 100 µg/m³, frequently exceed 400–500 µg/m³ during high pollution days (Delhi Pollution Control Committee monitoring data).
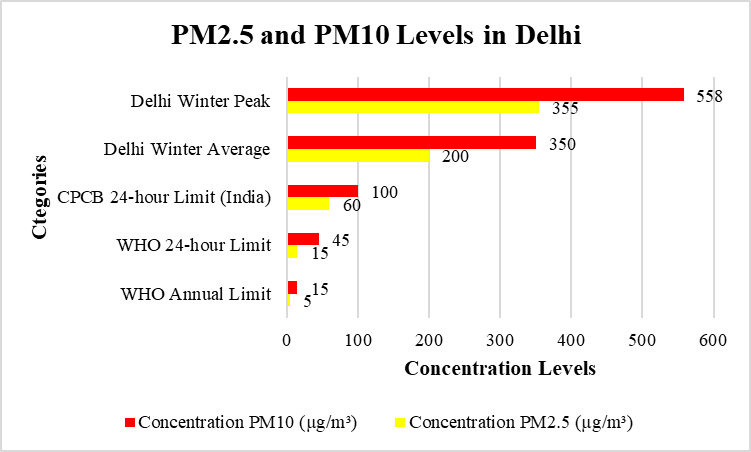
Statistically, Delhi’s residents inhale air that is 3–5 times worse than national standards and 20–40 times worse than global health guidelines.
Spatial Inequality: Pollution Hotspots Within the City
Government monitoring shows stark spatial variation. Industrial and traffic-heavy zones such as Anand Vihar, Mundka, Wazirpur, Jahangirpuri, and Rohini consistently record AQI values 20–30% higher than the city average (CPCB station-wise AQI data).
Data from SAFAR–India indicates that nighttime PM2.5 concentrations are 25–40% higher than daytime levels, due to reduced atmospheric mixing and temperature inversion (SAFAR winter air quality analysis).
This means pollution exposure is not uniform — lower-income and industrial-adjacent populations bear a disproportionate burden.
Also Read: Union Environment Minister Reviews Air Pollution Action Plans for Ghaziabad and Noida
Why Winter Turns Deadly: Meteorology Meets Emissions
Vehicular emissions account for approximately 40% of Delhi’s PM2.5 load, followed by road and construction dust (18–20%), industries (15–18%), and waste burning (5–7%) (IIT-Kanpur Source Apportionment Study, referenced by CPCB and MoEFCC).
Meteorological data show that average winter wind speeds in Delhi drop below 1.5 m/s, while mixing height reduces by over 60% compared to summer, severely restricting pollutant dispersion (India Meteorological Department and SAFAR reports).
When regional stubble-burning emissions coincide, PM2.5 concentrations increase by 10–25% on affected days (CPCB seasonal crop residue analysis).
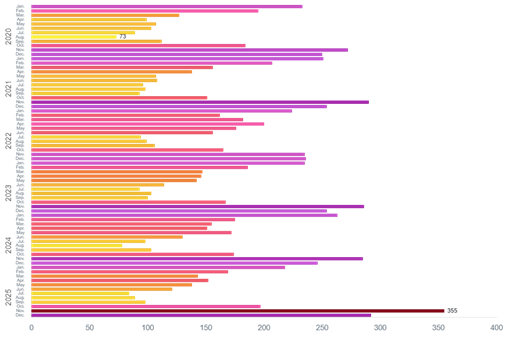

AQI Trends – Annual Air Quality Changes- Delhi, India, showing the highest AQI recording in winters. (Source: https://www.aqi.in/in/dashboard/india/delhi)
Health Impacts: Numbers Behind the Suffering
According to the Indian Council of Medical Research, air pollution contributes to nearly 1.6 million premature deaths annually in India, with Delhi among the highest contributors (ICMR Global Burden of Disease study).
In Delhi alone:
- Respiratory outpatient visits increase by 20–30% during severe AQI episodes
- Childhood asthma prevalence has risen by nearly 50% over the last two decades
- Long-term exposure reduces average life expectancy by up to 9–10 years (ICMR; Health Effects Institute reports)
Government hospital advisories report spikes in emergency admissions whenever AQI exceeds 300 for more than two consecutive days.
These figures underline that Delhi’s pollution is not just uncomfortable — it is lethal.
Also Read: Union Environment Minister Reviews Delhi-NCR Air Quality, Calls for Faster On-Ground Action
Policy Response: Emergency Actions Versus Reality
The Graded Response Action Plan (GRAP) mandates restrictions when AQI crosses set thresholds. Since its inception, GRAP has been invoked multiple times each winter, yet CPCB evaluations show that emergency measures typically reduce pollution by only 10–15%, often insufficient to bring AQI below hazardous levels (CAQM performance assessments).
Despite the National Clean Air Programme (NCAP) targeting a 20–30% reduction in PM levels, Delhi’s absolute pollution load remains high due to population growth and an increase in vehicles — Delhi now has over 12 million registered vehicles, more than Mumbai, Chennai, and Kolkata combined (Ministry of Road Transport and Highways data).
| Date (2025) | GRAP Stage | Avg AQI | PM2.5 (µg/m³) | PM10 (µg/m³) |
| 2/4/2025 | 1 | 215 | 78 | 180 |
| 10/4/2025 | 1 | 198 | 65 | 160 |
| 14-10-2025 | 1 | 225 | 82 | 195 |
| 19-10-2025 | 2 | 312 | 125 | 290 |
| 5/11/2025 | 2 | 345 | 150 | 330 |
| 11/11/2025 | 3 | 421 | 210 | 420 |
| 15-11-2025 | 3 | 448 | 235 | 460 |
| 21-11-2025 | 3 | 462 | 260 | 485 |
| 26-11-2025 | 2 | 358 | 165 | 340 |
| 30-11-2025 | 1 | 285 | 120 | 260 |
Table showing GRAP activation days vs AQI trends in Delhi in 2025.
Illusion of Improvement: A Fragile Decline
Official data indicate a marginal decline in annual average PM2.5 levels since 2018. However, winter peaks remain largely unchanged. Experts caution that averages mask extreme events, which drive health damage (MoEFCC annual environment reports).
Climate variability has further complicated pollution management, with erratic wind and rainfall patterns increasing stagnation episodes (India Meteorological Department climate summaries).
Also Read: CAQM Constitutes Expert Committee to Tackle Vehicular Air Pollution in Delhi-NCR
Citizens Coping, Systems Lagging
More than 70% of Delhi households now rely on masks or indoor air purification during winter, according to urban household surveys cited in government advisory reports. Schools routinely suspend outdoor activities, while outdoor workers face prolonged exposure with limited protection (CPCB public advisories).
Individual adaptation, experts warn, is a symptom of governance failure — not a solution.
An Emergency Demanding Structural Change
Delhi’s air pollution crisis is a data-backed emergency. Statistics repeatedly confirm that without aggressive emission reduction, regional coordination, and urban restructuring, the capital will remain locked in a cycle of winter toxicity.
“The AQI may reset daily — but the damage accumulates silently, breath by breath.”
References
- Central Pollution Control Board. (2024). National Air Quality Index (AQI) Bulletin and Air Quality Monitoring Data. Ministry of Environment, Forest and Climate Change, Government of India.
- Commission for Air Quality Management. (2024). Graded Response Action Plan (GRAP) Implementation Reports for NCR. Government of India.
- Delhi Pollution Control Committee. (2023). Source Apportionment and Emission Inventory of Delhi. Government of NCT of Delhi.
- Indian Council of Medical Research. (2020). Health Effects of Air Pollution in India. Ministry of Health and Family Welfare, Government of India.
- Ministry of Environment, Forest and Climate Change. (2022). National Clean Air Programme (NCAP): Progress Report. Government of India.
- Ministry of Road Transport and Highways. (2023). Vehicle Registration Statistics of Indian Cities. Government of India.
- SAFAR–India. (2024). Air Quality and Weather Forecast Reports for Delhi NCR. Ministry of Earth Sciences, Government of India.
- Standing Committee on Science and Technology, Environment and Climate Change. (2021). Report on Air Pollution in Delhi and NCR. Parliament of India.